Overview
SIRIUS 5 ships with a Graphical User Interface.
On top of the screen you find the toolbar (1-5).
The left most button group (1) is for creating, opening and saving project-spaces.
The second one (2) is for importing either a single compound or data containing multiple compounds into
the project-space. The third button group (3) is for exporting data, e.g. for GNPS FBMN
or writing project-space summaries.
The fourth button group (4) is for computations, containing “compute button”, “job view” and “custom database importer”.
The right most button group (5) contains “log”, “settings”, “webservice info” and “account info” dialogs.
“Help” links to this online documentation. “About” gives information on software licence and related publications.
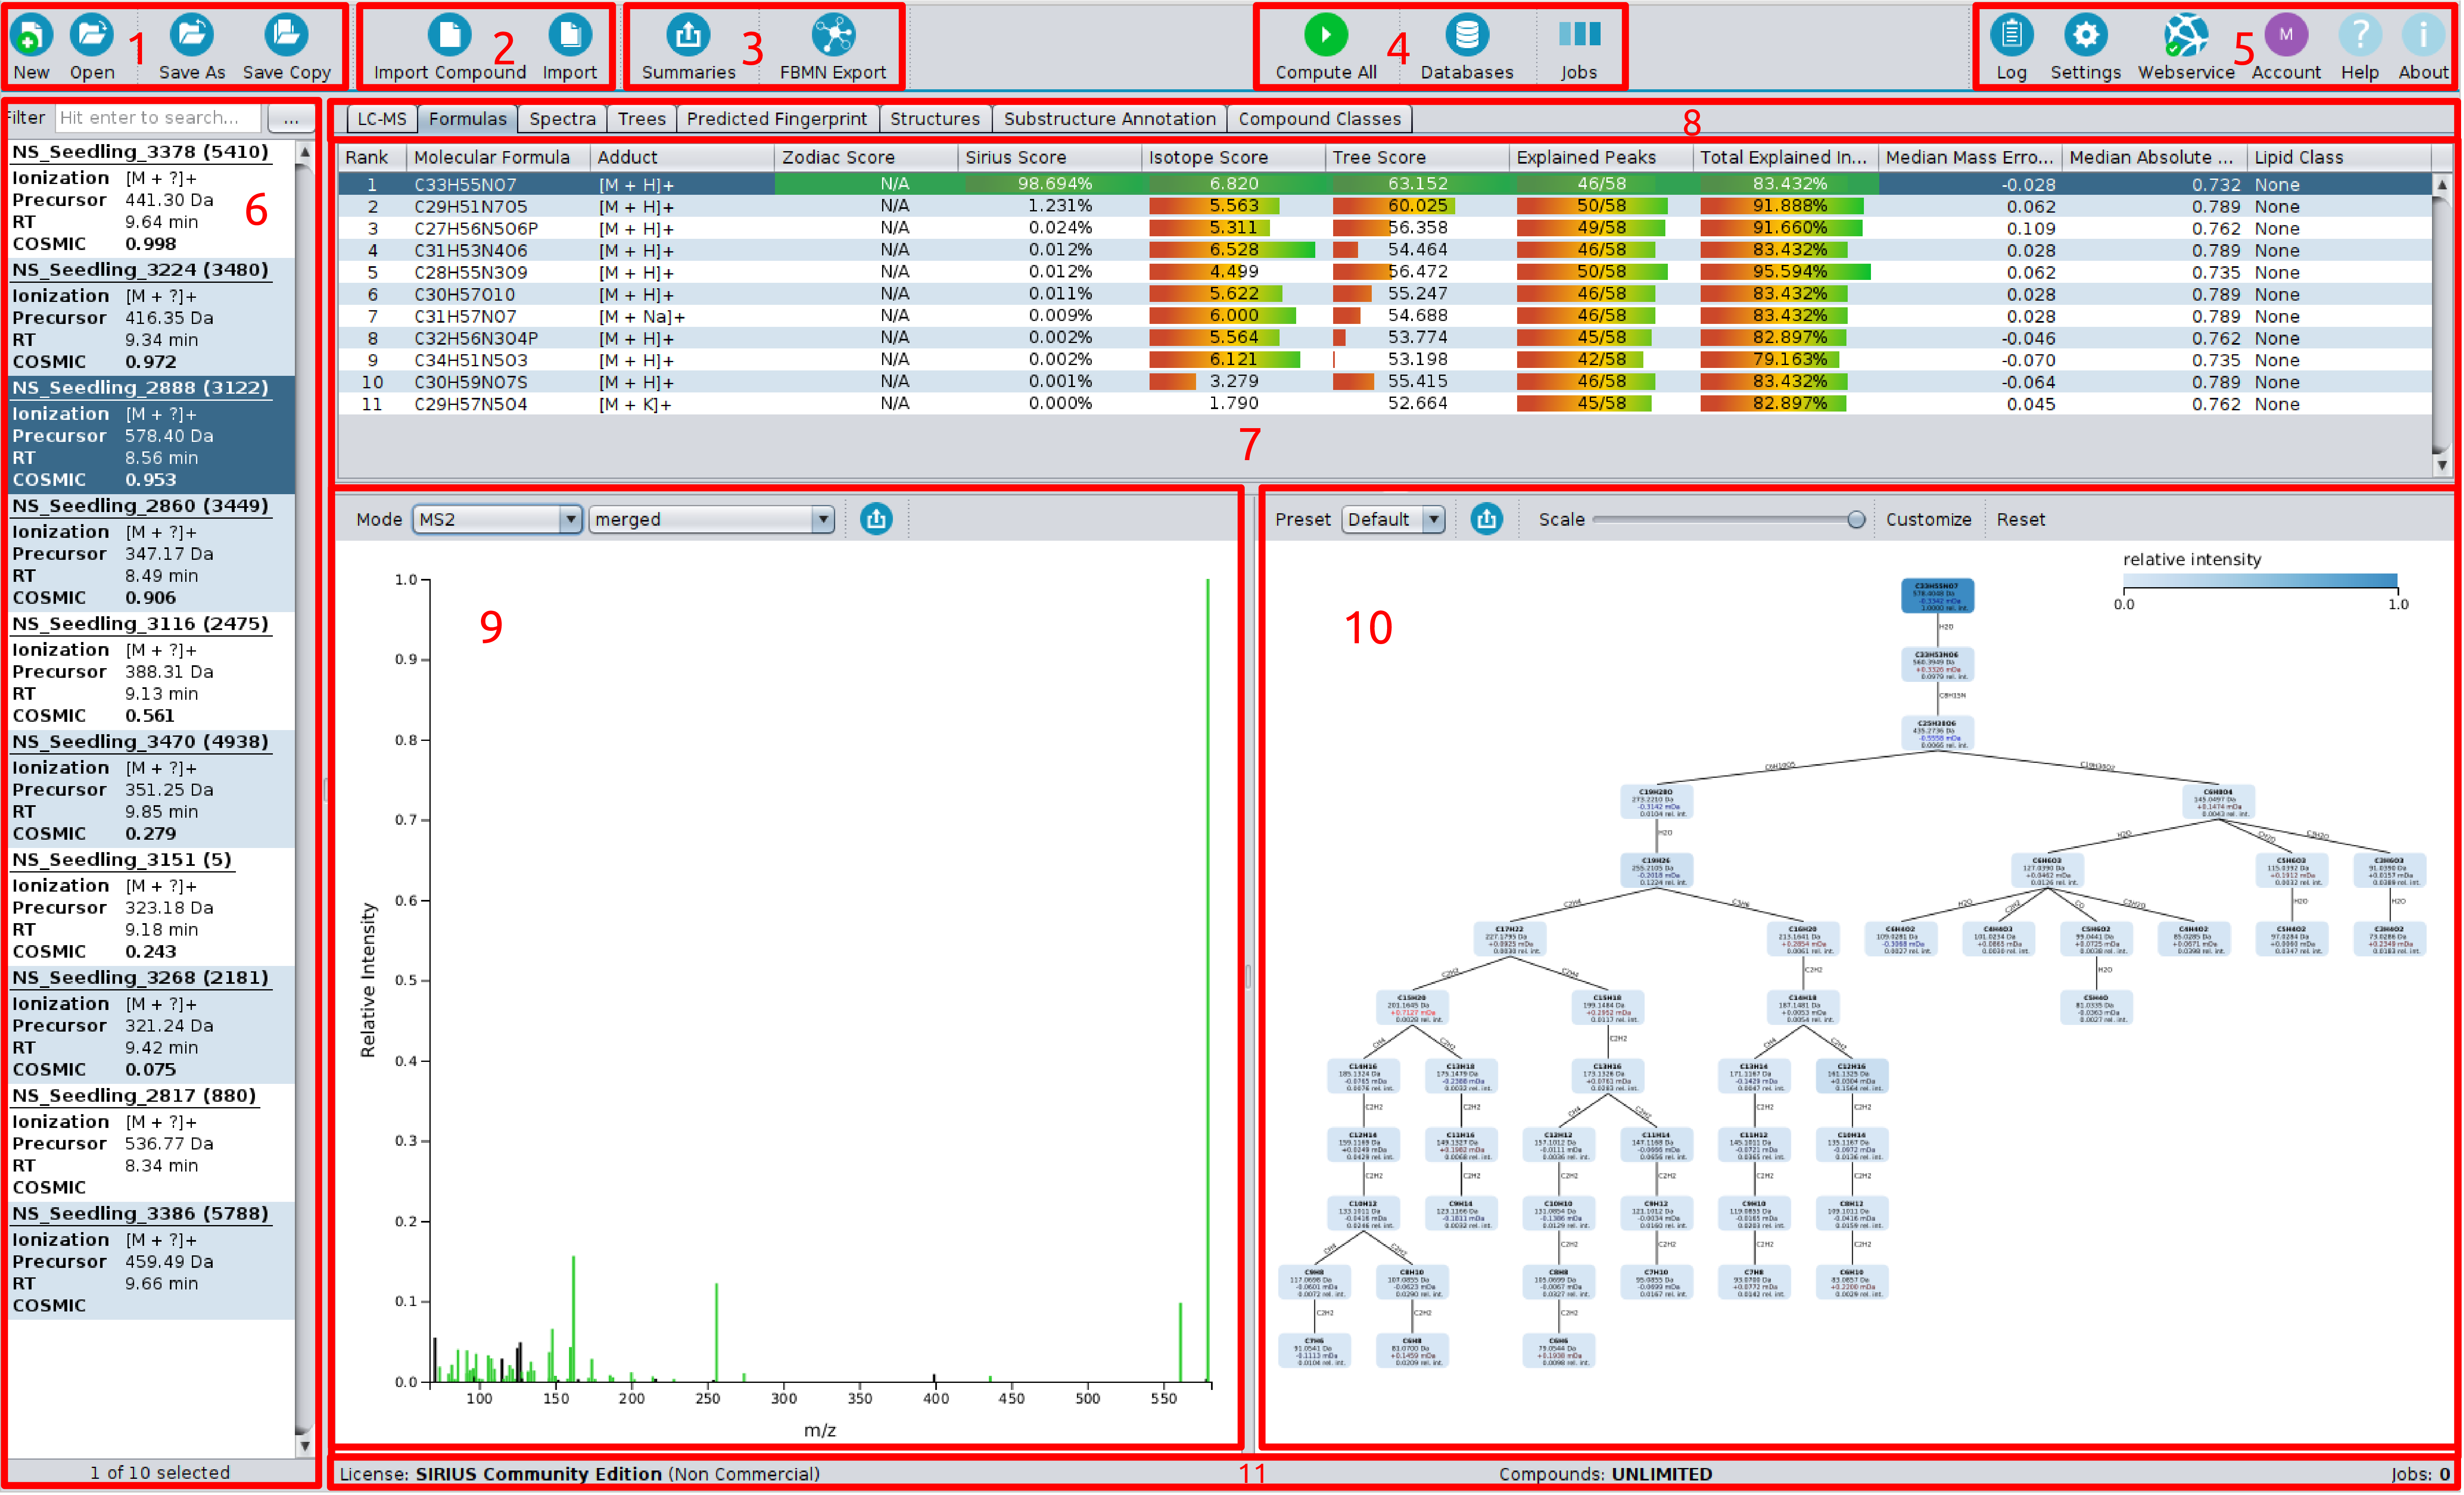
On the left side is the compound list (6) displaying all imported compounds. Each compound lists MS and MS/MS spectra corresponding to a single measured compound. For each compound adduct type, precursor mass and retention time ist shown. On the right side is the active result view (7). You can choose between different result views with the tab selector (8).
Here, the “Sirius Overview” is selected. The output of a Sirius computation (de novo formula identification) is an ordered list of suggested molecular formula candidates. After selecting a compound (dark blue background in the compound list) the results are displayed in the result pane. It shows a list of molecular formula candidates, sorted by score the corresponding spectrum (9) and the fragmentation tree (10) of the selected candidate molecular formula. Explained peaks are highlighted (green) in the spectrum. Nodes in the fragmentation tree are colored according to their relative intensity.
On the bottom (11), you find your license information for the webservice-based structure elucidation tools, the number of computed compounds and compound limits.
Data import
SIRIUS offers two modes for data import: Single compound import and Batch import. The single compound import is triggered when clicking on the “Import Compound” button in the toolbar. It allows you to import one compound. (We will use the term “compound” to refer to MS and MS/MS spectra belonging to exactly one adduct of a single compound - hence to one precursor.) The single import mode is recommended if your data consists of several CSV (comma separated values) files, such as the data from the CASMI challenges. First press on “Import Compound” to start the import dialog.
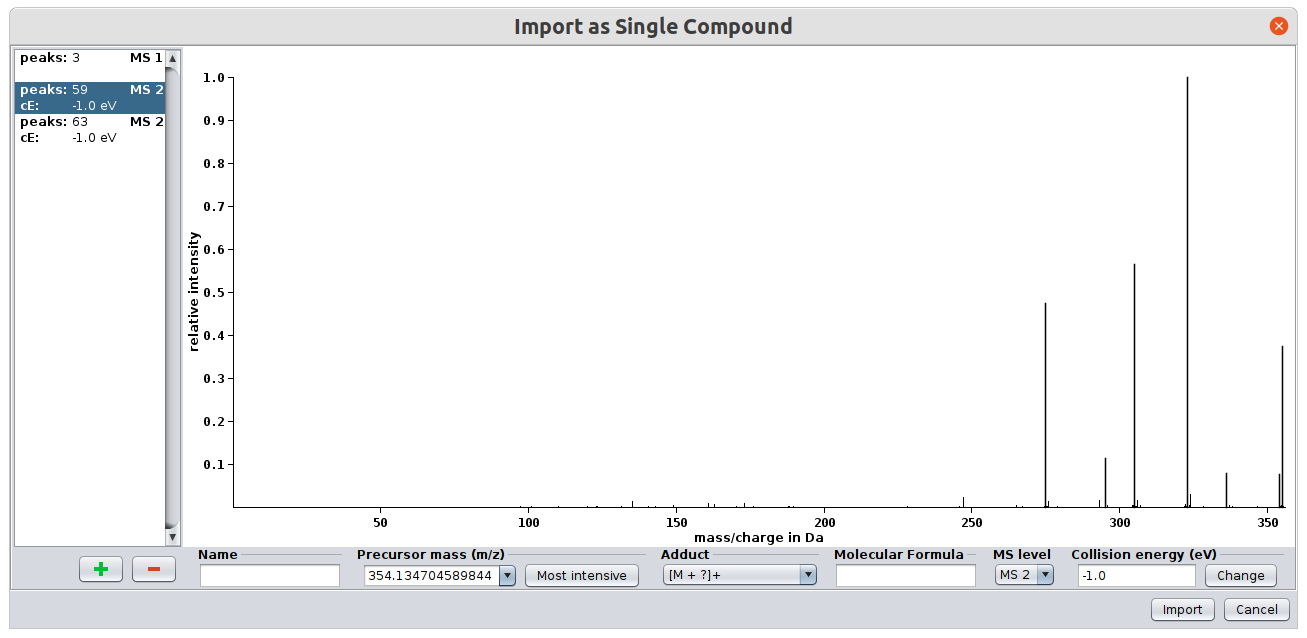
For each spectrum you have to select the MS level (either MS1 or MS/MS). If you have MSn spectra you can just import them as MS/MS spectra. You can select a name for the compound as well as an ionization mode. The collision energy is an optional attribute as it does not affect the computation.
You can import .ms, .mgf, Agilent’s .cef and .mzml (or .mzxml) files using the “Import” button or Drag’n’Drop.
In this mode SIRIUS will read all attributes (MS level, ionization, precursor mass) directly
from the file. You can, however, change these attributes afterward by
selecting the imported compound and clicking on the Edit button.
When importing multiple .mzml (or .mzxml) at once, SIRIUS will ask you if it should align them.
See Input Formats for descriptions of file formats and further details.
Computing results
As for importing data SIRIUS offers two computation modes: Single Computation and Batch Computation. The Single Computation allows you to setup different parameters for each compound. You can trigger it by right-clicking on a single compound and choosing Compute in the context menu or by double clicking a compound.
Right-clicking multiple selected compounds and choosing Compute will trigger batch computation for the selected compounds. Clicking the “Compute All” button (toolbar) will compute all compounds in the project-space.
Both dialogs are very similar. In Single Computations element prediction can be performed by clicking the respective button. In Batch Computations check boxes indicate the elements that are automatically predicted for each compound. Also, you can select if results for compounds that already have been analyzed should be recomputed and overridden.
The Show Command button shows the respective CLI command for the specified parameters. Hence, you can copy/paste this command and run analysis using the CLI.
In the following, the Batch Computation dialog is shown.
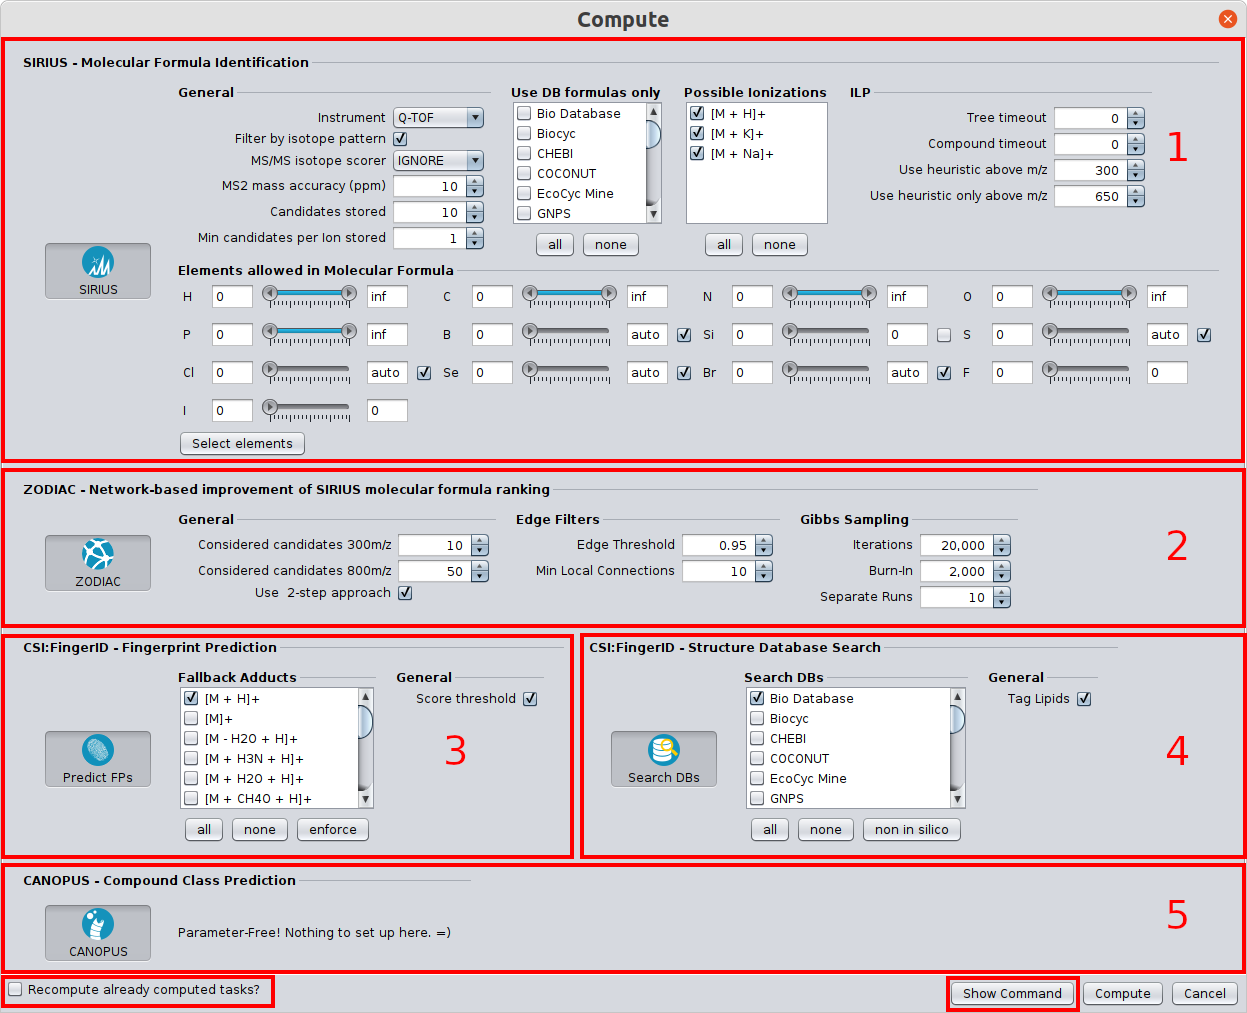
Identifying molecular formulas with the SIRIUS tool (1)
Parent mass (single compound mode)
The exact m/z of the parent peak. If MS1 data is present, the m/z of the monoisotopic peak is presented as default. Otherwise, an autocompletion offers a list of high intensive peaks from the MS/MS spectra.
Elements allowed in the Formula
SIRIUS will use the elements carbon (C), hydrogen (H), nitrogen (N), oxygen (O), phosphorus (P) and sulfur (S) by default. Additional elements can be selected within the Select elements dialog. Adding additional elements will increase running time. Using (too many) elements that do not occur in the correct molecular formula of the compound might worsen the results.
The automated detection of a set of “uncommon elements” is available if the isotope pattern is provided. These elements are sulfur (S), chlorine (Cl), bromine (Br), boron (B), and selenium (Se). Using Auto detect (single compound mode) will clear your element selection and will set new values based on the detection. Autodetection is usually quite sensitive and rather overpredicts the actual quantity of an element.
Other
[TODO: description of ionization and adducts.]
Choose either Q-TOF, Orbitrap or FT-ICR in the instrument field. The chosen instrument affects only very few parameters of the method (mainly the allowed mass deviation). If your instrument is not one of these three then just select the Q-TOF instrument.
You can change the maximal allowed mass deviation in the ppm field. SIRIUS will only consider molecular formulas which mass deviations below the chosen ppm; for masses below 200 Da, the allowed mass deviation is $(200 \cdot \frac{ppm_{max}}{10^6})$.
You can select the number of molecular formula candidates that should be reported in the output, and what molecular formulas are considered as candidates: If you do not select any database then SIRIUS will enumerate over all molecular formulas that match the ion mass, filtering out only molecular formulas with negative ring double bond equivalent (default). If you select a database for fomrula search, SIRIUS will select/score all molecular formulas from the selected databases. The Option organic formulas ignores molecular formulas containing elements untypical for organic compounds such as Si or Mg; molecular formulas pass this filter if they are composed solely of CHNOPSBBrClIF.
-
We never search in these databases directly, but rather in our local database copies. Although we regularly update our database, it may happen that some new compound in, say, ChEBI is not already contained in our local copy.
-
When selecting databases, SIRIUS will ignore your element restrictions and instead allow all elements.
-
We do not recommend restricting molecular formula search to (biomolecule) databases, but doing so significantly speeds up computations, as SIRIUS has to consider significantly less molecular formulas and download significantly smaller candidate structure lists.
Improve molecular formula ranking with the ZODIAC tool (2)
ZODIAC performs de novo molecular formula annotation on complete biological datasets (high-resolution, high mass accuracy LC-MS/MS runs). ZODIAC takes fragmentation trees as input and reranks the molecular formula candidates by taking similarities of compounds in the dataset into account.
To run Zodiac, select SIRIUS and ZODIAC in the batch compute panel. Increase the number of reported candidates for SIRIUS, to increase the chance that the correct molecular formula candidate is contained in the result list. Click “compute”.
Click here to visit the Zodiac release page.
Predicting the molecular fingerprint with the CSI:FingerID tool (3)
After computing the fragmentation trees you can predict molecular fingerprints. These can be used to either search in a structure database or predict compound classes with CANOPUS.
Specified fallback adducts are used in case no adduct has been detected for the compound. If “score threshold” is activated, fingerprints are only calculated for the top scoring fragmentation trees (molecular formulas).
Identifying the molecular structure with the CSI:FingerID tool (4)
Predicted molecular fingerprints can be searched in a structure database.
When selecting the CSI:FingerID search you can again select multiple structure databases. When searching in biomolecule databases you might never see if there are structures with possibly much better score from PubChem. Therefore, we recommend to search in PubChem and filter the result list if you expect the result to be contained in biomolecule databases. Note: Searching in a small database will not longer speedup computations since SIRIUS has to score whole PubChem to compute confidence measures or merge results with customs dbs anyways.
[TODO: description of filter options etc.]
Import of custom structure databases
Custom structure databases can be added via the “Databases” interface (4) located at the top center of the GUI ribbon.
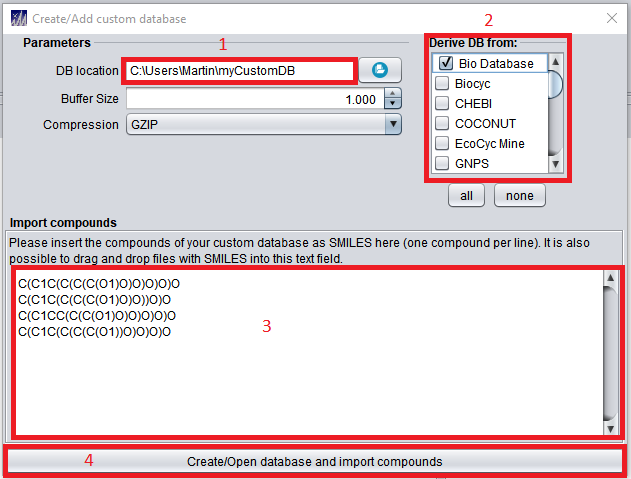
The database location (1) needs to be any valid, writeable path including a name for the newly created custom database (see above image for an example). In newer versions of SIRIUS 5, this path can not be empty to default to the SIRIUS home directory anymore. During import, users can choose to “inherit” an existing structure database (2). Inheriting an existing database will add all structures of the inherited database to the custom database. Custom structures in SMILES format to be imported into the new custom database can be imported in (3) as shown in above image, or be supplied via a csv/tsv (tab separated) file with structures given in SMILES format. Clicking the “Create/Open” Button (4) will create the custom structure database. See here for more details regarding custom structure database import and for the CLI subtool.
COSMIC - confidence values for CSI:FingerID searches
Calculating COSMIC confidence scores is parameter free and will be executed automatically every time a CSI:FingerID search is performed. COSMIC scores for a compound are shown in the compound list on the left.
Click here to visit the COSMIC release page.
Predicting Compound classes with the CANOPUS tool (5)
CANOPUS predicts ClassyFire compound classes from the molecular fingerprint. Class prediction is done without using any structure database. Thus, classes are predicted for all compounds for which the fragmentation tree contains at least three fragments, including compounds that have no structure candidate in the database. There are no parameters to set. Similar to molecular fingerprints, compound classes are predicted for each molecular formula separately.
In the ClassyFire ontology, every compound belongs to multiple compound classes. A compound class describes a structural pattern. For example, a dipeptide is also an amino acid (because it ** contains** an amino acid substructure), as well as a carboxylic acid (for the same reason). A glycosylated amino acid might belong to both compound classes: amino acids and hexoses. Different from how compound classes are often described in chemistry textbooks, ClassyFire compound classes do not describe the biosynthetic origin. For example, a phytosteroid might be classified as bile acids in Classyfire, because both class of compounds share the same backbone, although they are involved in different biochemical pathways.
Click here to visit the CANOPUS release page.
Visualization of the results
The compound list shows not only information about the input and compute state, it further shows the COSMIC confidence score for the top CSI:FingerID hit.
For each compound different tabs can be shown in the result panel. The “LC-MS” tab displays the chromatogram of a compound for it monoisotopic- and further isotope peaks, as well as possibly detected adducts. It includes a basic quality assessment of the spectrum. The “Formulas” panel displays the most important information of the molecular formula identification. The candidate list contains the best candidate molecular formulas ordered by score. Molecular formulas are always written in neutral form. For the selected molecular formula candidates the Spectra view visualizes which peak is assigned to a fragment. The corresponding fragmentation tree is visualized in the Tree view. Both views can be displayed in a separate panel to have a more detailed look. The “Fingerprint” panel shows information about the molecular properties of the molecular fingerprint predicted by CSI:FingerID. The “Structures” panel displays results from the CSI:FingerID structure search, while the “Substructure Annotation” panel shows possible substructures connected to the peaks of the MS/MS spectrumfor each candidate. The “CANOPUS” panel shows the Classyfire classes predicted by CANOPUS.
LC-MS tab
The LC-MS tab is only visible when LC-MS data (mzML or mzXML) was used for import. When the data came from MGF, ms or similar file formats, the LC-MS information is not available. This is also the case when LC-MS data was processed with OpenMS or MZMine and the results were imported to SIRIUS.
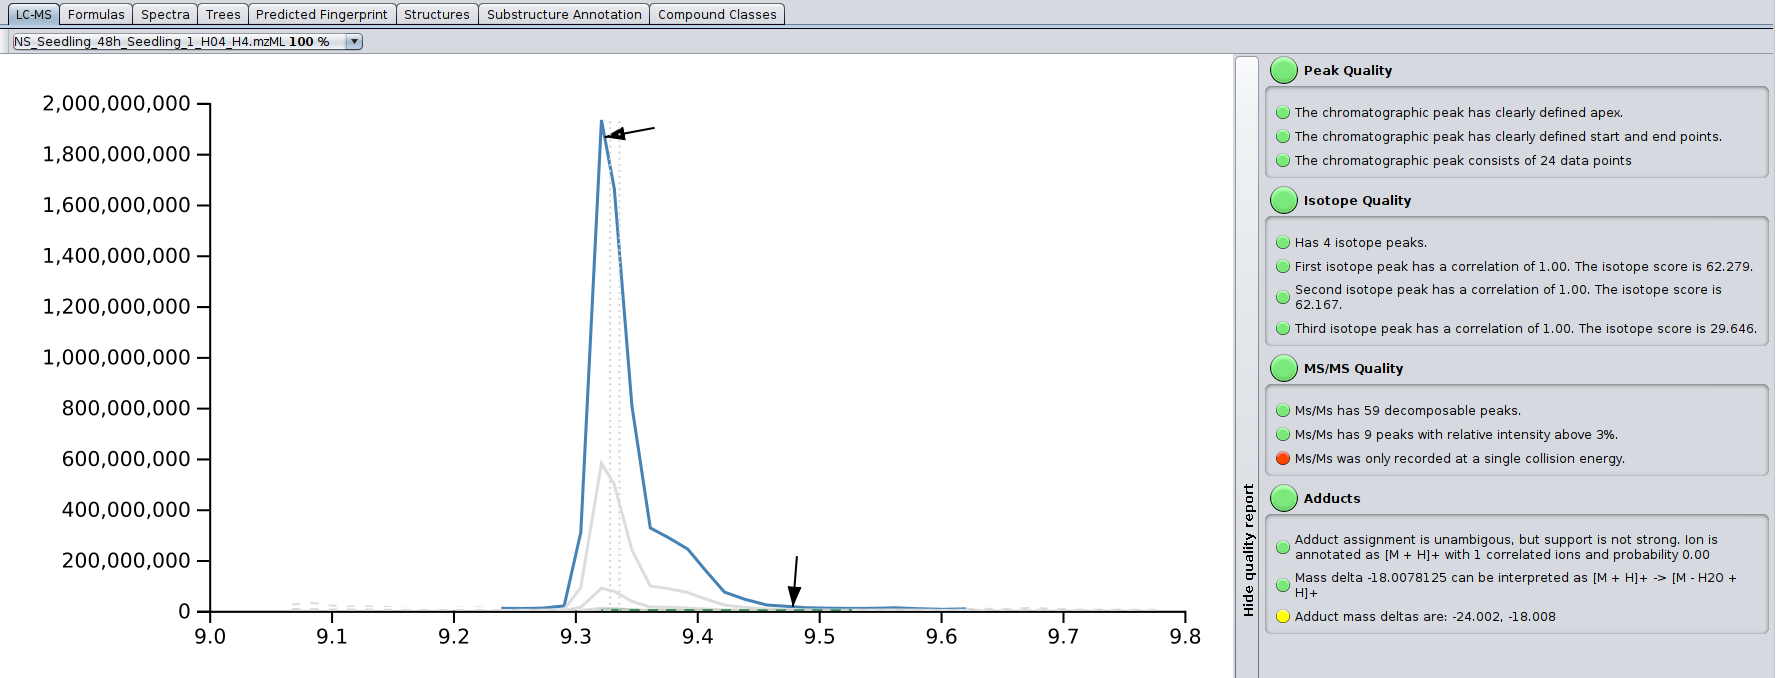
The LC-MS tab displays the ion chromatogram of a compound (in blue), including its isotope peaks, possible in-source fragments (in brown), as well as detected adducts (in green) for each input file in which the compound was detected. Retention times are always given in minutes. The extended ion chromatogram (gray, dashed) is the mass trace that is not part of the detected peak (e.g., a second ion with same mass or just background noise with same mass). In case MS/MS data of the compound was extracted from the selected LC-MS input file, a black arrow marks the retention time at which the MS/MS was shot. A gray dashed line marks the noise level; its exact computation may varies from version to version, but it is related to the median intensity of all peaks in the MS scan. Two gray vertical dashed lines mark the median and weighted average retention time of the compound across all input LC-MS data files.
On the right, there is a basic quality assessment panel. It can be used to preemptively get an idea on overall quality of the MS and MS/MS of the compound.
Formulas tab (“SIRIUS overview” in SIRIUS4)
The “Formulas” tab displays the candidate list, spectrum and fragmentation tree of the selected candidate. Candidates are ordered by total score, but can be sorted by any other column. A green row highlights the molecular formula of the best candidate structure found by CSI:FingerID.
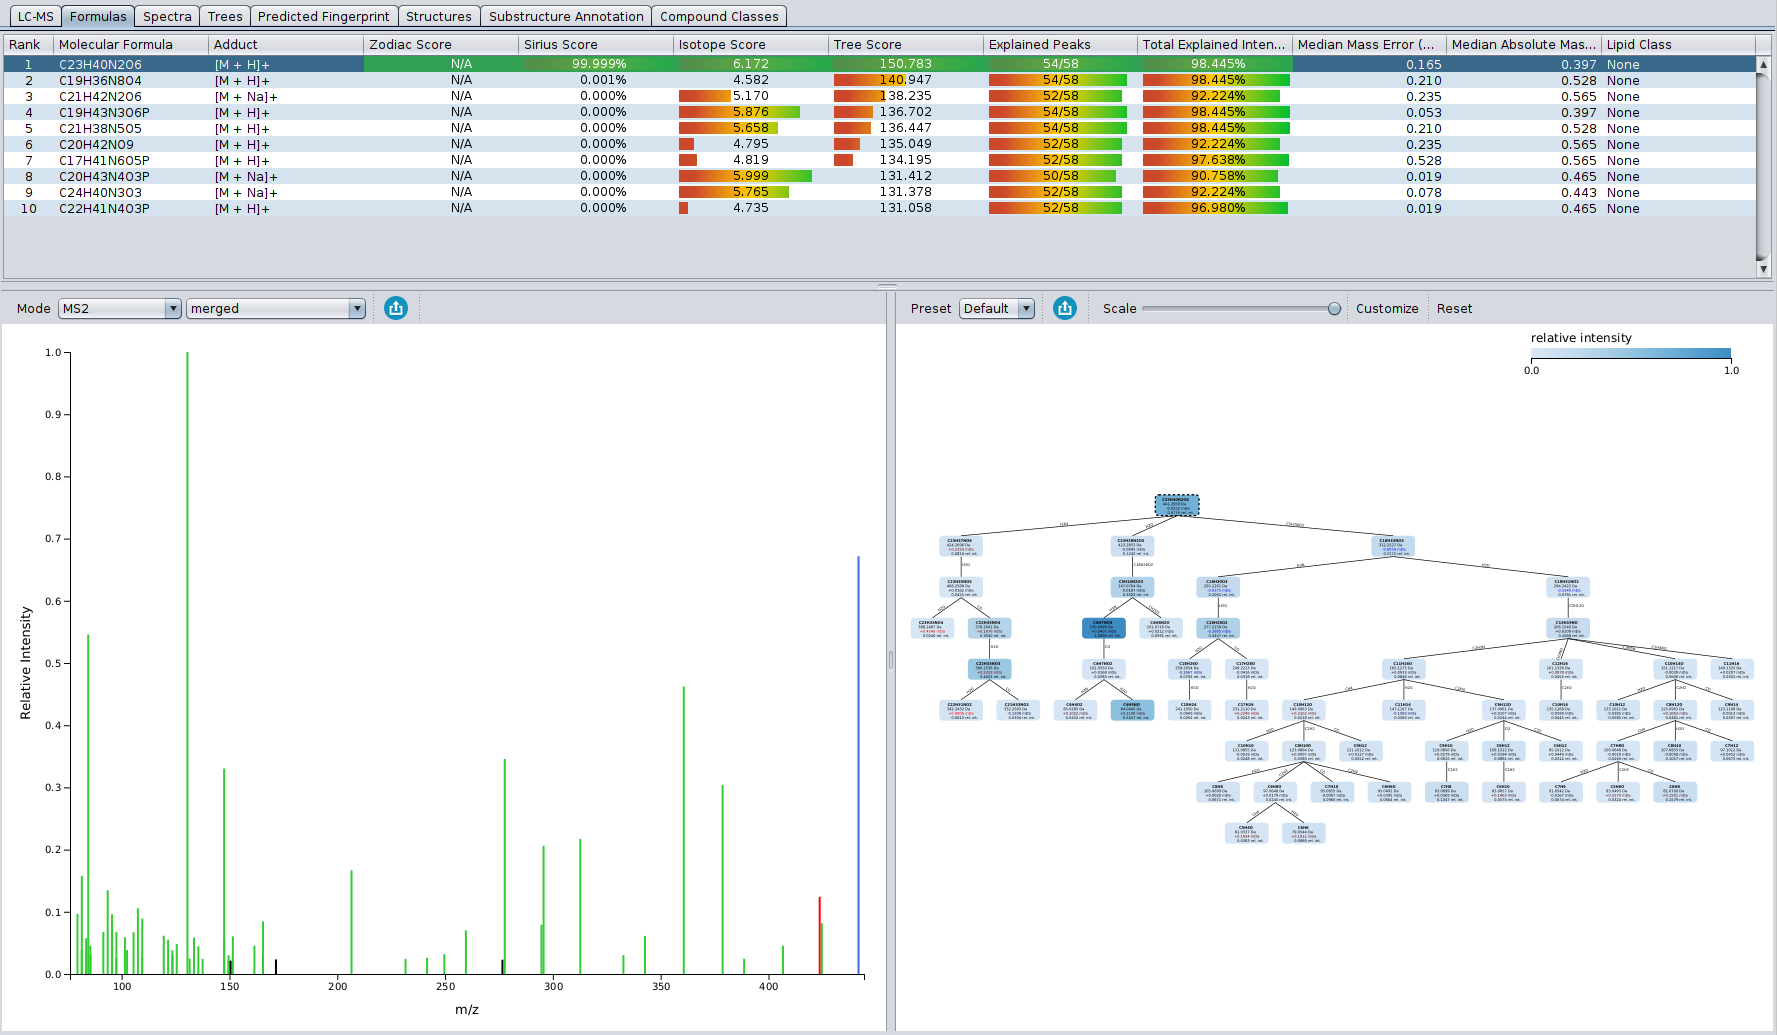
The length of the bars for the different score columns (isotope pattern, fragmentation pattern, Sirius (isotope + tree), zodiac) as well as the displayed numbers for columns Isotope Score and Tree Score, correspond to logarithms of maximum likelihoods (probability that this hypothesis, i.e. molecular formula, will generate the observed data). In contrast, the number in the Sirius Score column is the posterior probability of the hypothesis (molecular formula), and these probabilities sum to one. A higher posterior probability of the top hit may indicate that this molecular formula has a higher chance of being correct; but we stress that **a posterior probability of 90%, must not be misunderstood as a 90% probability that this molecular formula identification is correct! ** The displayed probabilities are neither q-values nor Posterior Error Probabilities.
Tree view tab
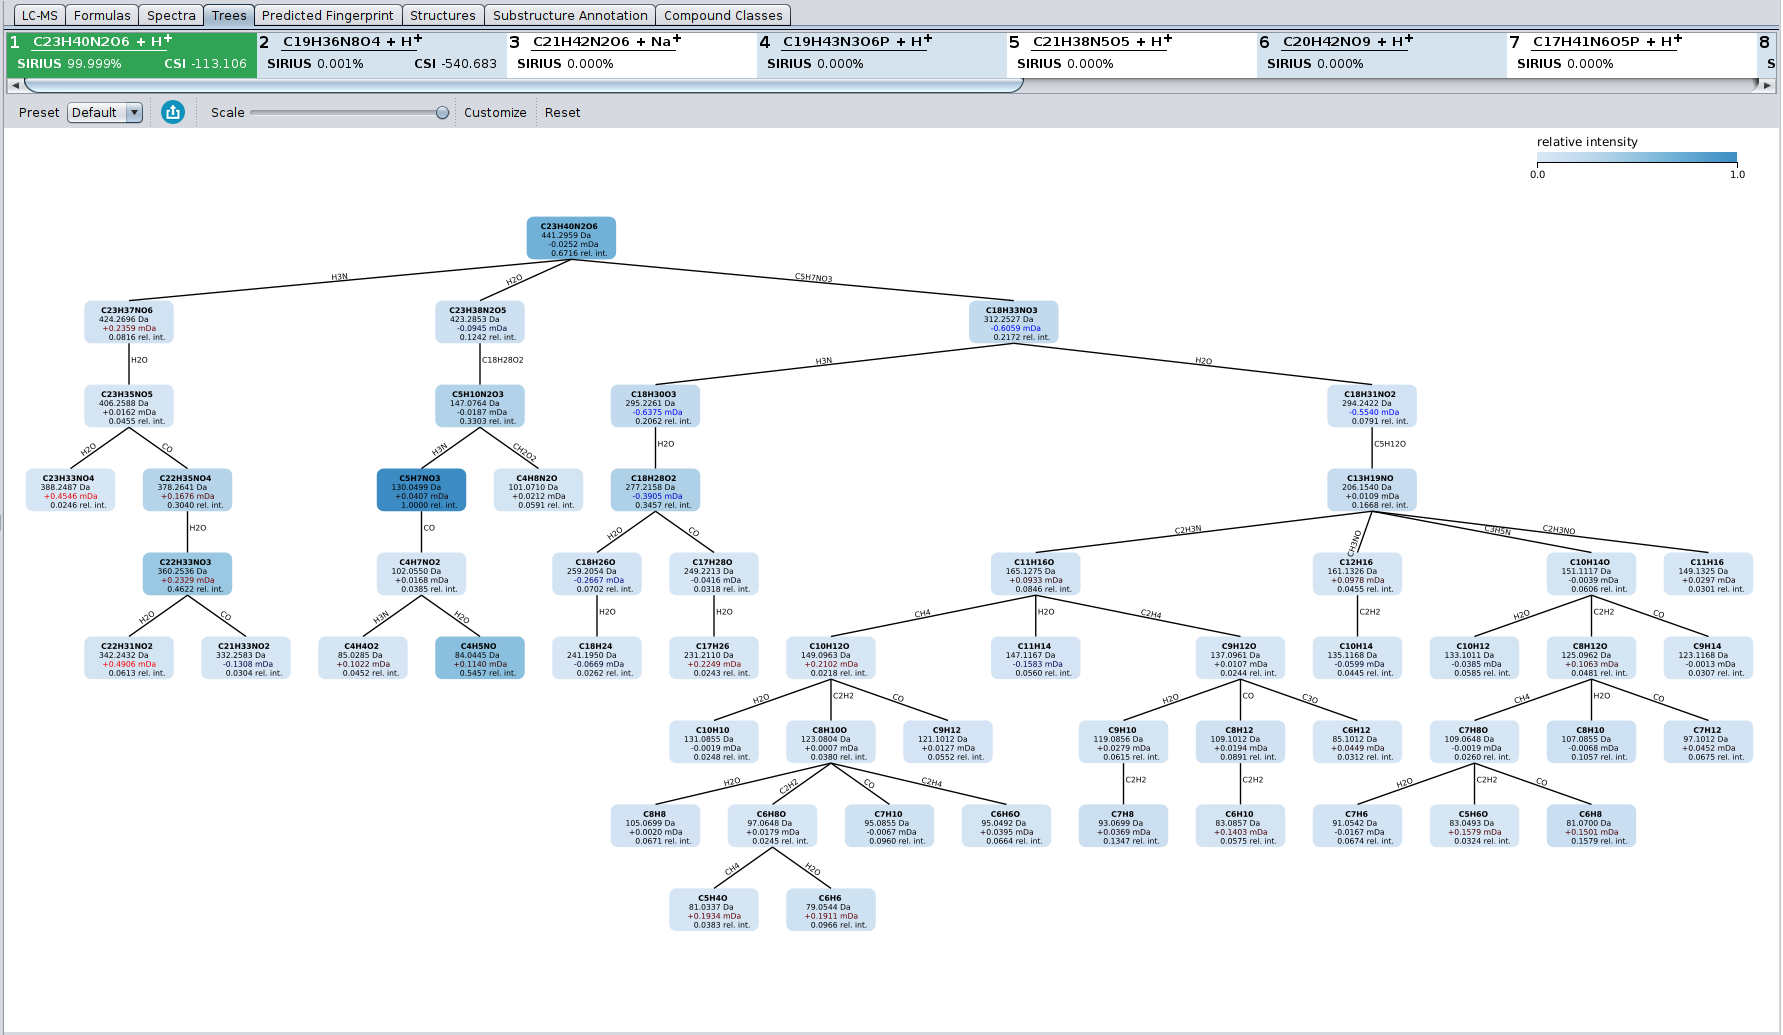
The Tree view tab displays the estimated fragmentation tree. Each node in this tree assigns a molecular formula to a peak in the (merged) MS/MS spectrum. Each edge is a hypothetical fragmentation reaction. The user has the choice between different node styles and color schemes.
Export tree visualization
The displayed fragmentation tree can be exported as svg or pdf vector graphics.
Alternatively, the dot file format contains a text description of the
tree. It can be used to render the tree externally. The command-line
tool Graphviz can transform dot files into image formats (pdf, svg, png
etc). The json format yields a machine-readable representation of the
tree. See the ftree-export cli tool for how to export fragmentation trees from
the command line.
Spectrum view tab
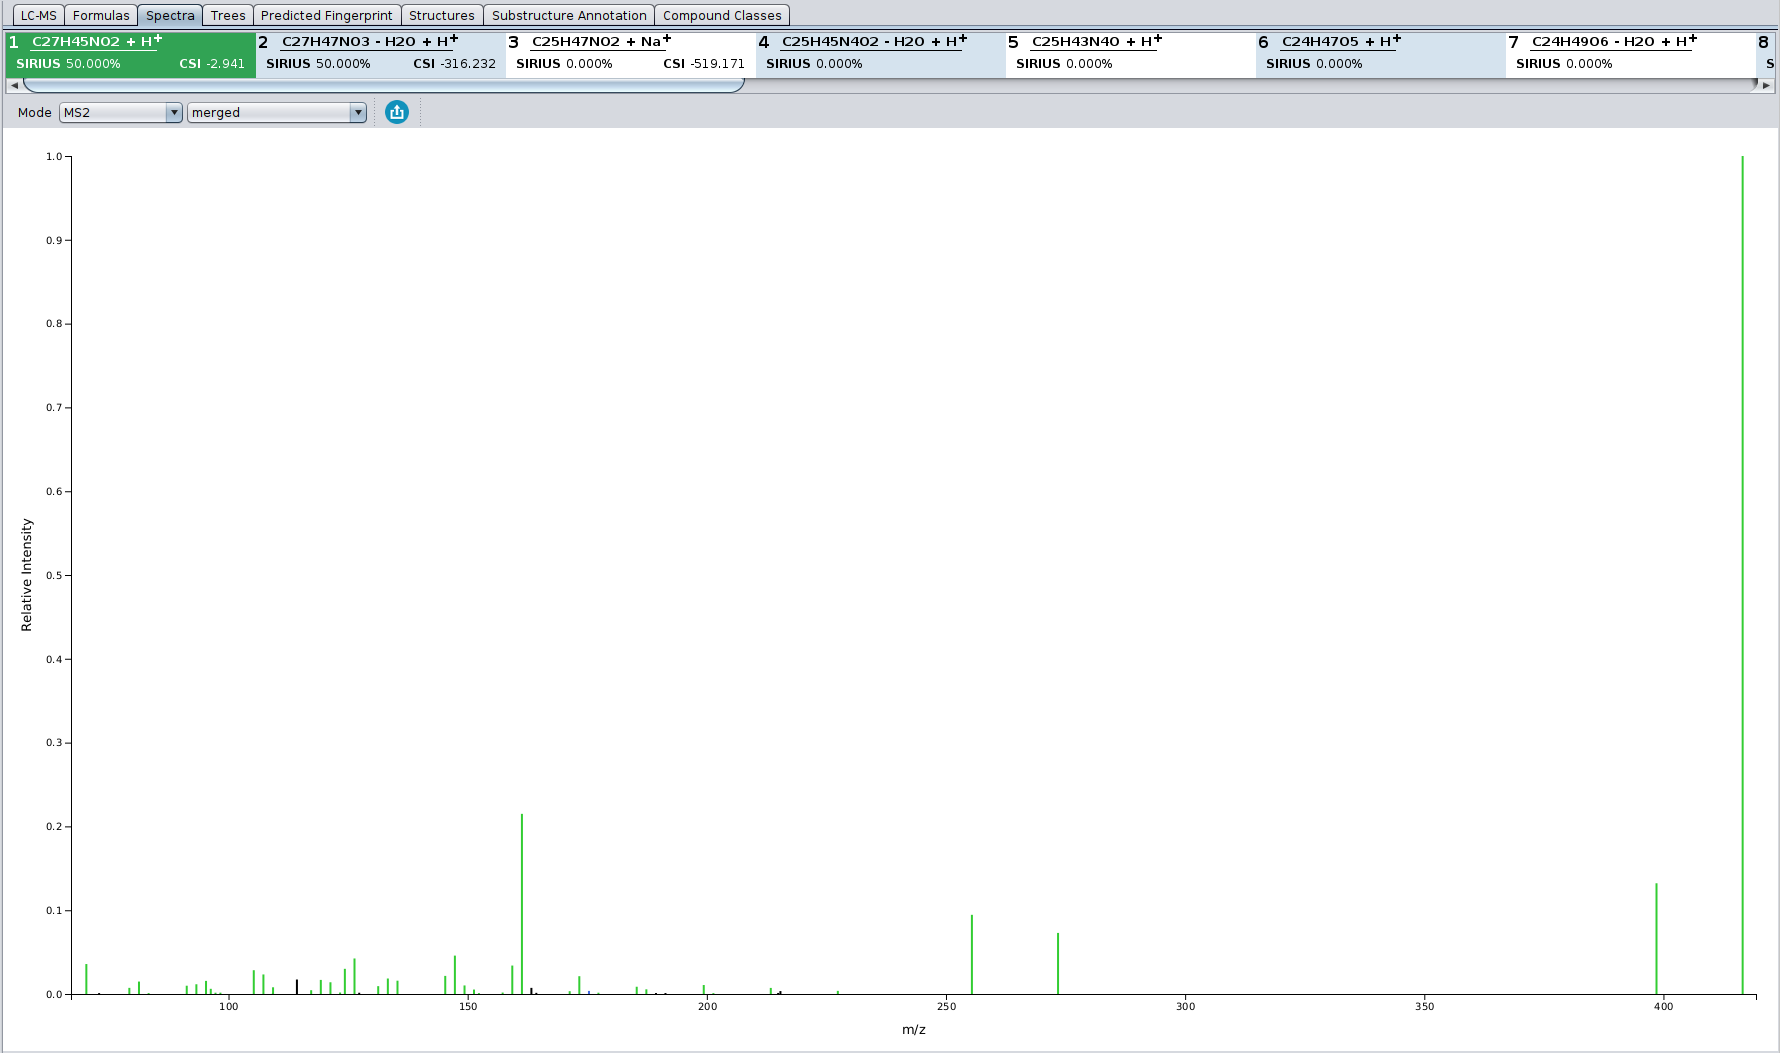
In the Spectrum view tab, all peaks that are annotated by the fragmentation tree are colored in green. Peaks that are annotated as noise are colored black. Hovering with the mouse over a peak shows its detailed annotation.
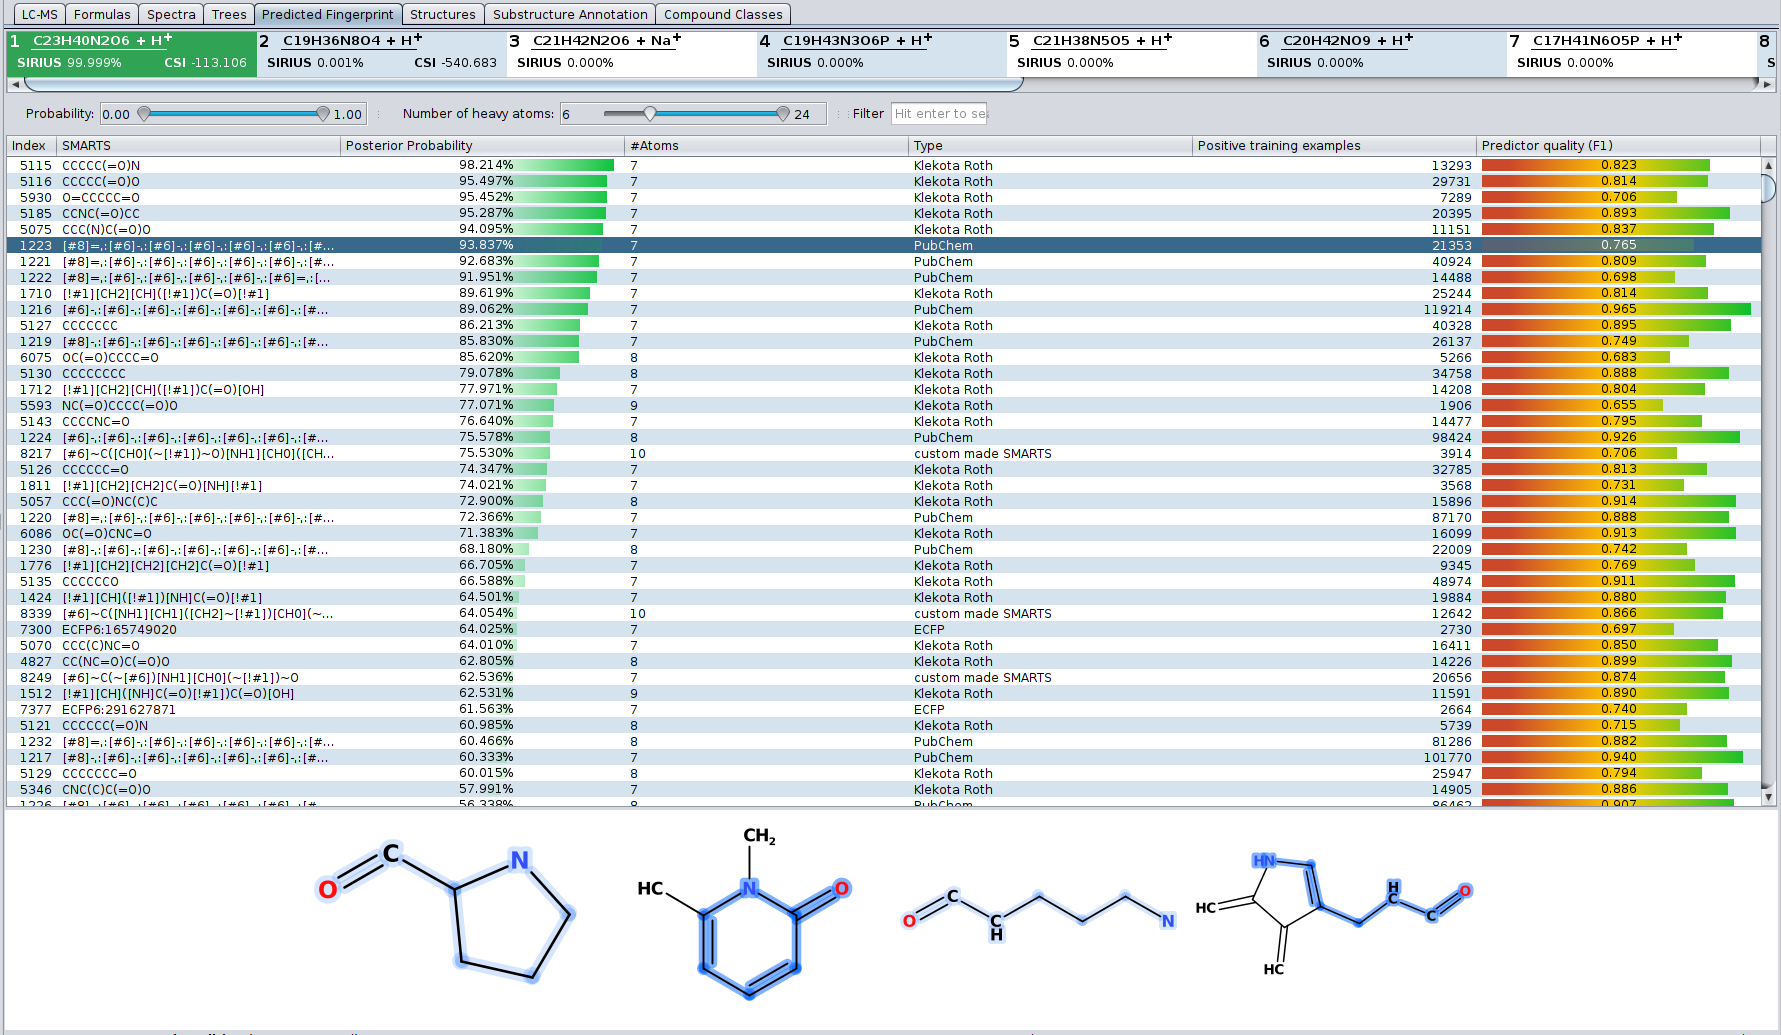
Fingerprint tab
Even if the correct structure is not found by CSI:FingerID — in particular if the correct structure is not contained in any database — you can get information about the structure by looking at the predicted fingerprint. The “Fingerprint” tab shows a list of all molecular properties the predicted fingerprint consists of. For each molecular property its definition and posterior propability is shown as well as some information about the predictor for this property. When selecting a molecular property, examples for this property are shown below the list.
Structures tab (“CSI:FingerID Detail” tab in SIRIUS4)
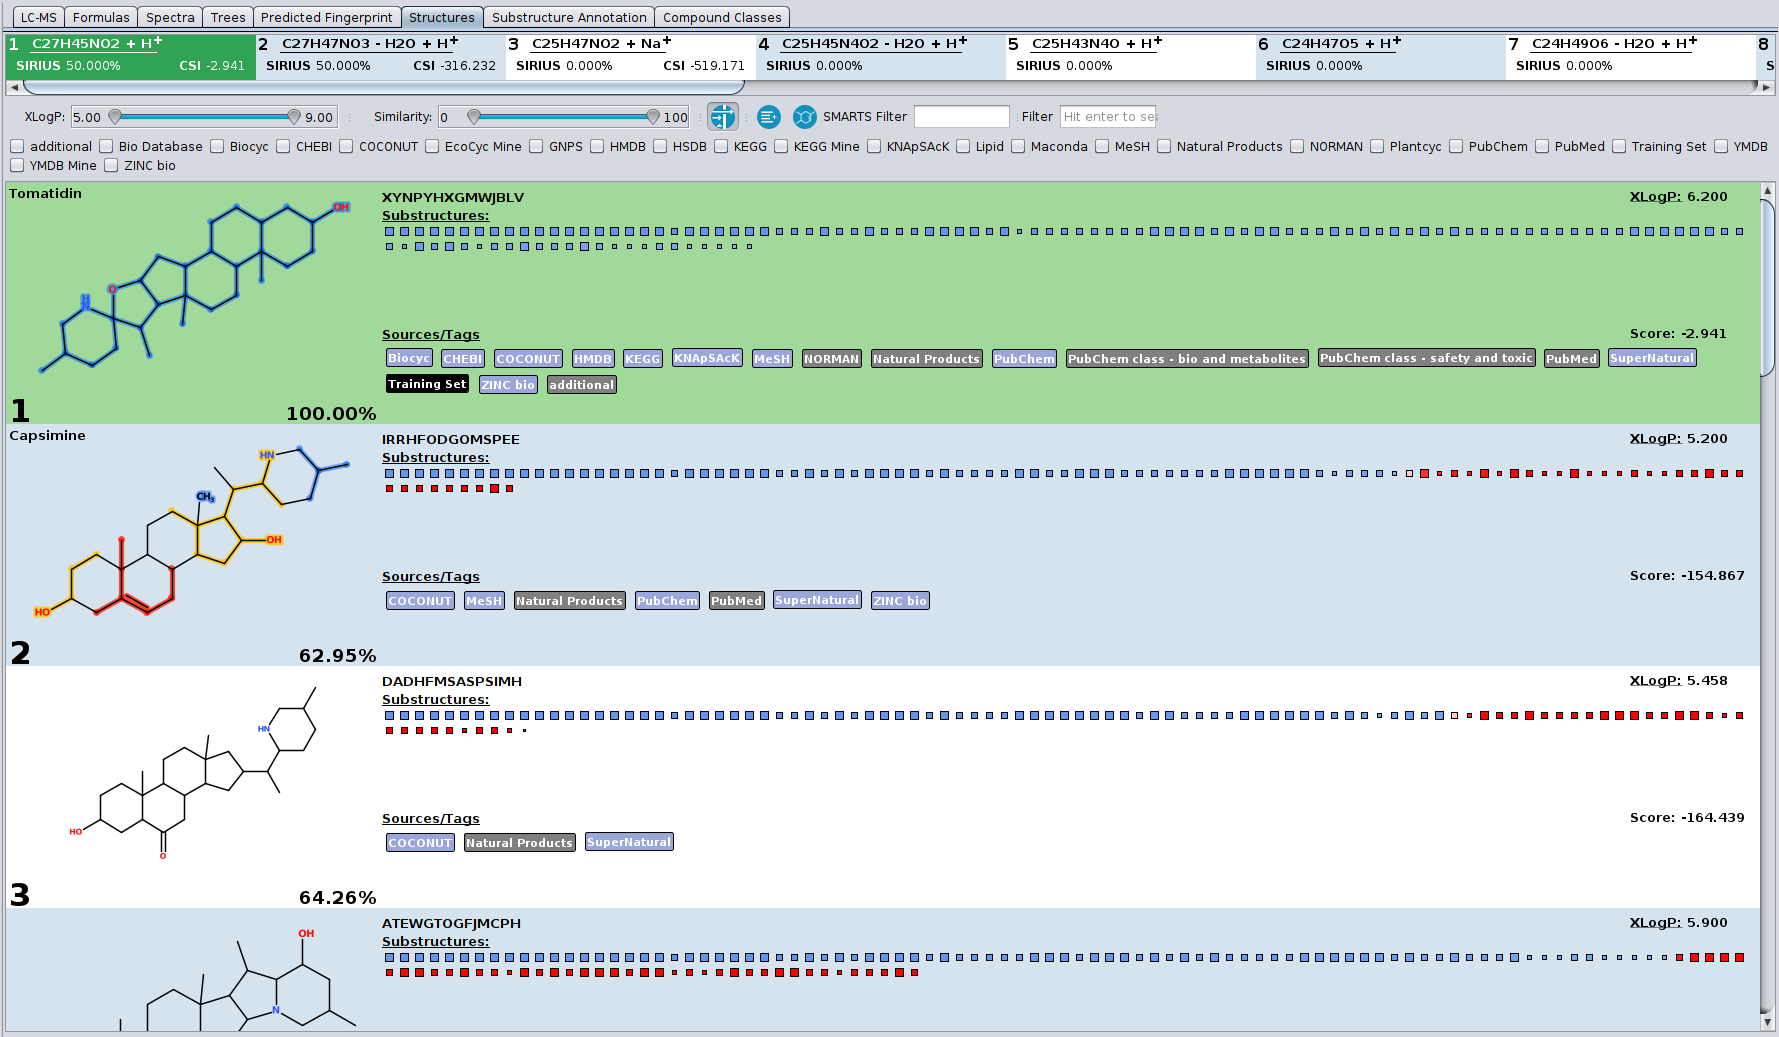
This tab shows you the candidate structures for the selected molecular formula ordered by the CSI:FingerID search score. If you want to filter the candidate list by a certain database (e.g. only compounds from KEGG and BioCyc) you can press the filter button. A menu will open displaying all available databases. Only candidates will be displayed that are enabled in this filter menu. If you want to see only compounds from KEGG and BioCyc you have to check only KEGG and BioCyc.
Another way of filtering is the XLogP slider. If you have information about retention times and expected logP values of your measured compound you can use this slider to filter the candidate list by certain XLogP values. The slider allows you to define min and max values. XLogP is calculated using the Chemistry Development Kit (CDK).
The blue and red squares are some visualization of the CSI:FingerID predictions and scoring. All blue squares represent molecular structures that are found in the candidate structure and are predicted by CSI:FingerID to be present in the measured compound. The more intense the color of the square the higher is the predicted probability for the presence of this substructure. The larger the square the more reliable is the predictor. The red squares, however, represent structures that are predicted to be absent but are, nevertheless, found in the candidate structure. Again, as more intense the square as higher the predicted probability that this structure should be absent. Therefore, a lot of large intense blue squares and as few as possible large intense red squares are a good indication for a correct prediction.
When hovering with the mouse over these squares the corresponding description of the molecular structure (usually a SMART expression) is displayed. When clicking on one of these squares, the corresponding atoms in the molecule that belong to this substructure are highlighted. If the substructure matches several times in the molecule, it is once highlighted in dark blue while all other matches are highlighted in a translucent blue.
You can enable filtering by the selected substructure (button with the structure), to only show candidates that contain the selected substructure. Further, you can filter the candidate list using a SMARTS pattern or full-text search.
You can open a context menu by right click on the compound. It offers you to open the compound in PubChem or copy the InChI or InChI key in your clipboard.
If the compound is contained in any database, a blue or grey label with the name of this database is displayed below the compound. You can click on blue labels to open the database entry in your browser window. Yellow labels indicate that the candidate is contained in the corresponding custom database. A red label indicates that this candidate is flagged with an unknown database. This can for example happen when loading results that have been computed with a custom database that is not available on the current system. Black labels are just additional information such as if the candidate is part of the CSI:FingerID training data.
This tab also includes visualization for the “El Gordo” lipid class annotation functionality. Lipid structures are often extremely similar to each other, often only differing in the position of the double bonds. These extremely similar structures are often not even differentiable by mass spectrometry at all, which is why the overarching lipid class is shown above the structure candidates.
Substructure Annotation tab
In this tab, a direct connection between the input MS/MS spectrum and the CSI:FingerID structure candidates is visualized. The table in the top part of the view shows all structure candidates for a given query that were also present in the “Structures” tab. By selecting them, the bottom part of the view shows the fragmentation spectrum on the left, as well as the given structure candidate on the right.
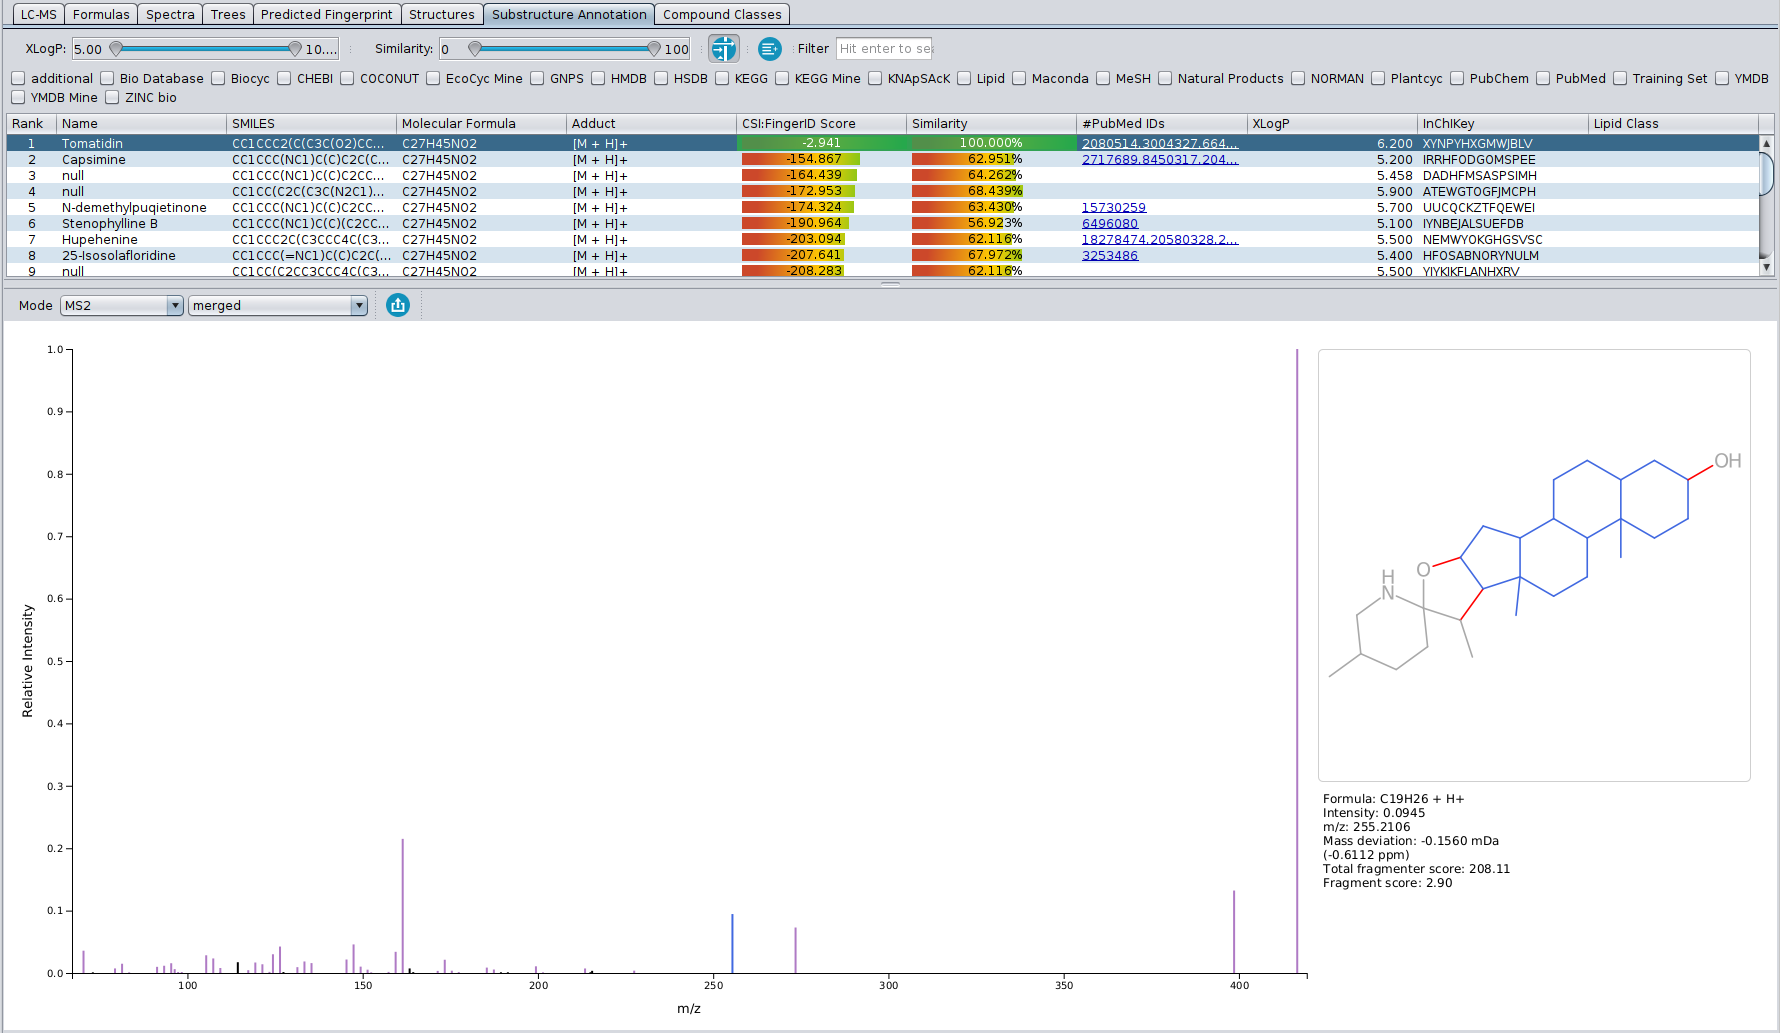
Peaks in the fragmentation spectrum are color coded as follows:
-Black peaks: Peaks that are not used to explain the molecular formula of the candidate, and are as such not part of the fragmentation tree (just like in the “Formulas” tab). Usually, these peaks can be considered as noise or not explainable by the precursor ions molecular formula.
-Green peaks: Peaks that are used to explain the molecular formula of the candidate, and as such are part of the fragmentation tree (just like in the “Formulas” tab), but do not have a substructure associated to them (see below)
-Purple peaks: Peaks that are used to explain the molecular formula of the candidate, AND can be associated to a specific substrucure of the candidate’s structure. Possible substructures are combinatorially generated and then scored against the peaks in the spectrum, with the highest scoring substructure for each peak being displayed on the right. Blue atoms and bonds make the substructure, while red bonds denote the fragmentation that would have needed to occur for that fragment to be formed.
Peaks can be navigated by left-clicking on them, or using the arrow keys.
CANOPUS tab
Compound class predictions are visualized as table similar to molecular fingerprints: Each row in the table describes one class. The posterior probability is the probability that the measured spectrum (given the chosen molecular formula) belongs to this compound class. The other columns contain all related information from the ClassyFire ontology.
Above the table are two lists: main classes and alternative classes. The main class of a measurement is the most specific compound class from all compound classes with posterior probability above 50%. The main classes list contains the main class, as well as its ancestors in the Classyfire ontology. The alternative classes list contains all over classes with posterior probability above 50%.
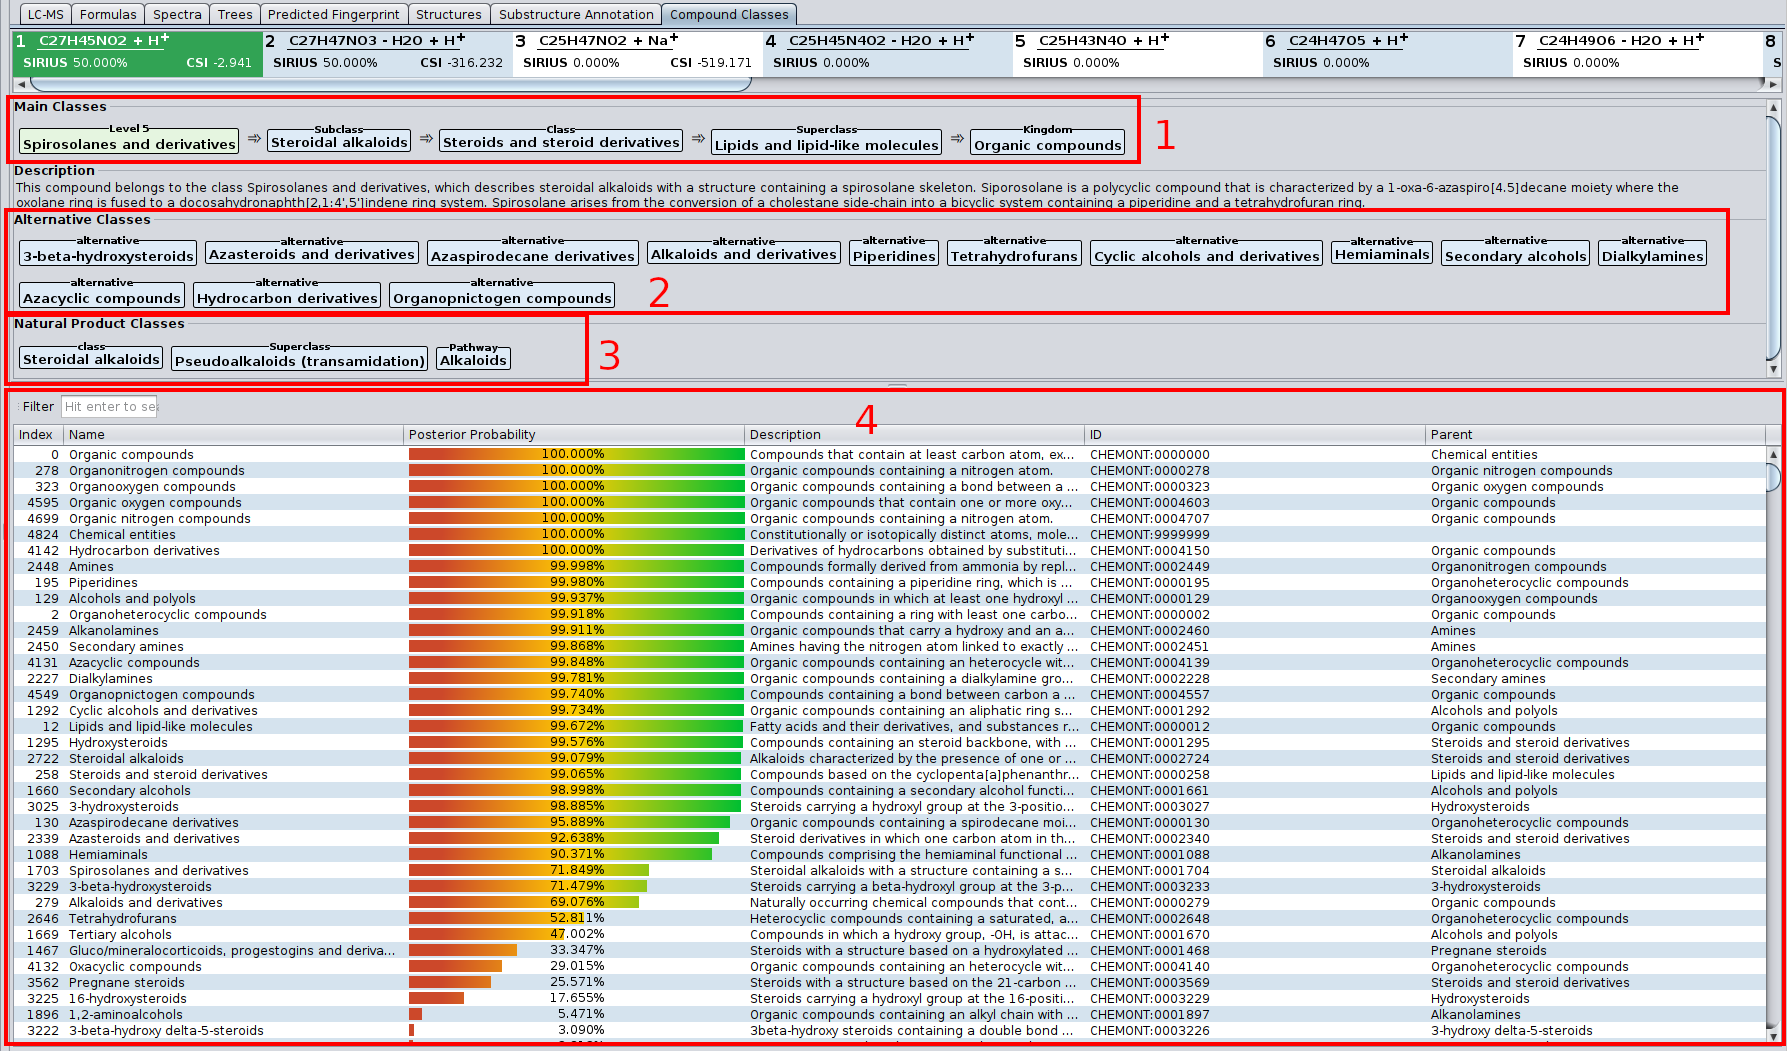
- (1) The most informative class (light green), and its ancestor classes (light blue).
- (2) Alternative classes. In the ClassyFire chemontology, every compound is assigned to multiple classes. In this example, the compound kaempferol is a flavonoid, but also a benzenoid.
- (3) The table lists all ClassyFire classes, with description parent class and so on. The colored bar denotes the predicted probability for this class. Only classes with probability above 0.5 are listed in (1) and (2).
Starting from SIRIUS 5, this tab also contains the predicted Natural Product classes.
Settings
-
General settings
-
Allowed solvers: chose the ILP solver for SIRIUS to use for fragmentation tree computation. GLPK is free, Gurobi is commericial but offers free academic license.
-
Database cache: location of cache directory. CSI:FingerID download candidate structures from our server and caches them for faster retrieval.
-
-
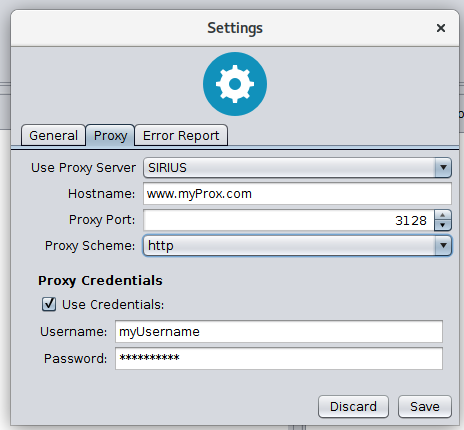
Proxy settings
-
Sirius supports proxy configuration. It can be enabled by changing the proxy configuration from NONE to SIRIUS. If SIRIUS is selected it uses the configuration you have specified int the Settings -> Network panel. If NONE is selected Sirius ignores all proxy settings.
-
Edit the information in the Settings -> Network panel if you want to address CSI:FingerID via a proxy server. Your specified configuration will be tested if you hit the save button (see Figure below).
-
-
Error report settings
-
Add an email address which will be sent with a bug report. This makes it possible for us to contact you, in case we need additional information to solve your problem.
-
Decide whether specific hardware and operating system information is send with your bug report.
-
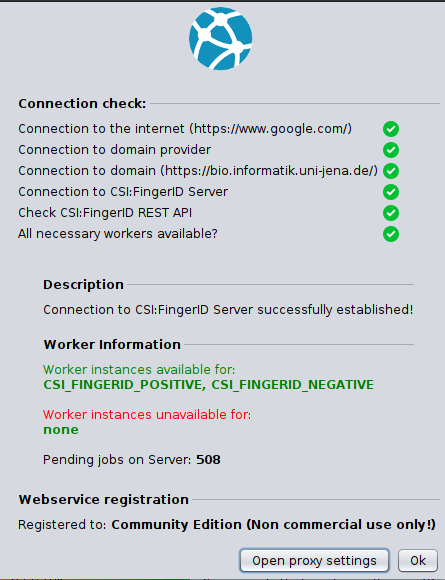
Webservice
[TODO: description of connection check dialog.]