- You can download some sample spectra from the SIRIUS website.
- To get started quickly you may also want to have a look at our video tutorials.
Graphical User Interface
Analyzing multiple compounds
SIRIUS’s “Batch mode” corresponds to analyzing many compounds at once, each having one or more mass spectra. Obviously, you can also use this workflow to analyze a single compound.
-
Move the files
demo-data/ms/Bicuculline.msanddemo-data/ms/Kaempferol.msand from the demo data via Drag and Drop into the application window. -
The two compounds are now displayed in the compound list.
-
Just check if the ionization and parent mass is correctly annotated. You can change this values by right-clicking on the compound and then on Edit.
-
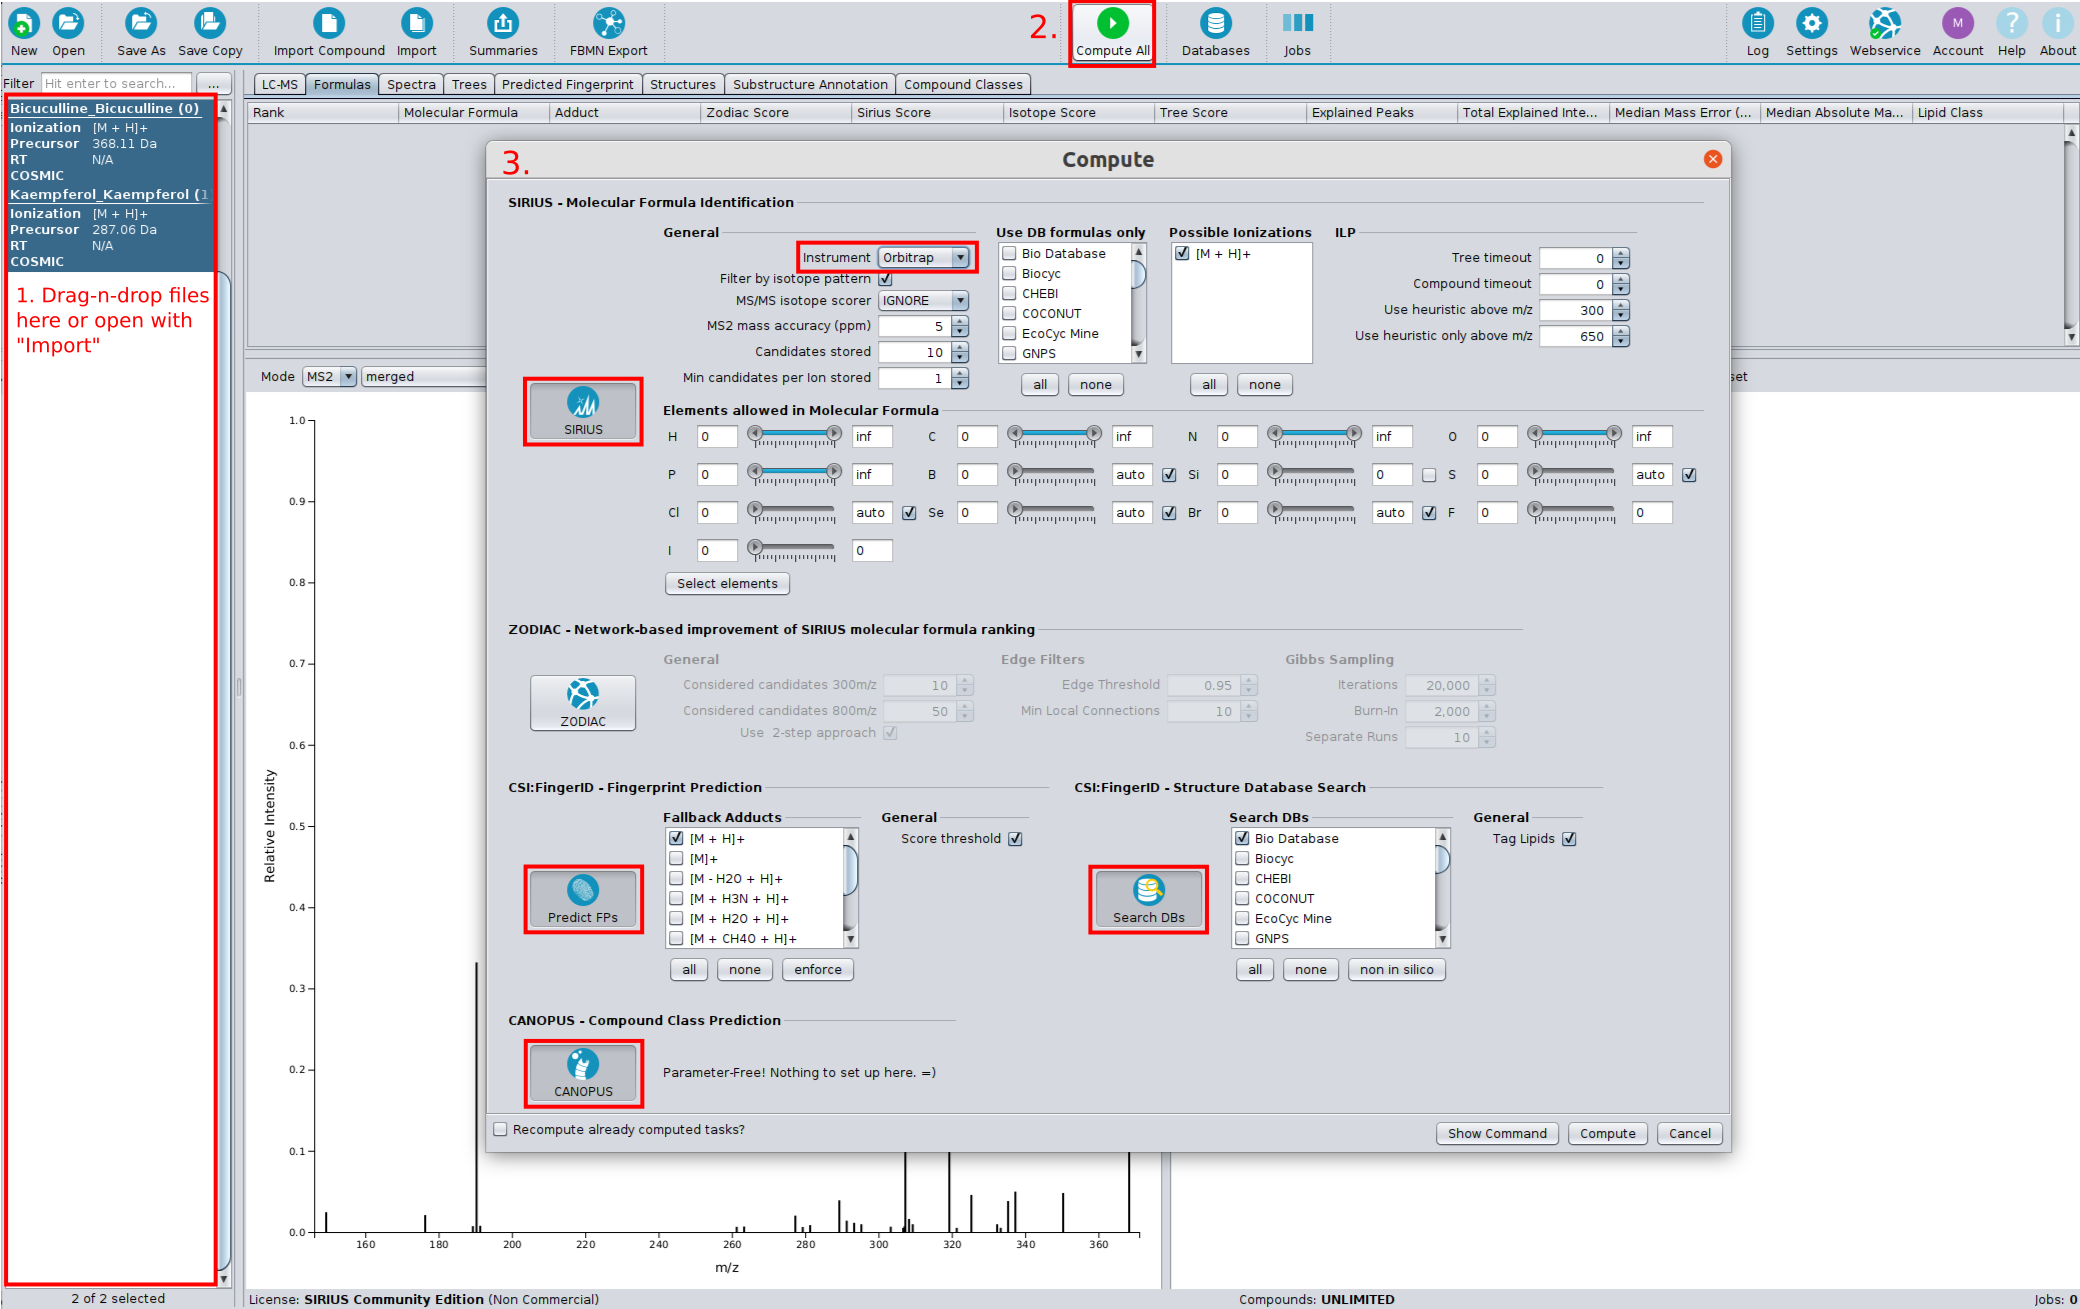
Click on the Compute All button.
-
Select SIRIUS.
-
You can now select the allowed elements, the instrument type as well as the maximal allowed mass deviation. Be aware that this settings will be used for all imported compounds
- Choose Orbitrap in the instrument field and press OK
- Select Predict FPs to predict the compounds’ molecular fingerprints with CSI:FingerID.
- Select Search DBs to search compounds in a structure database with CSI:FingerID.
- Select CANOPUS to predict compound classes (database-free).
-
Click Compute.
-
A gear symbol occurs on the lower right corner of each compound. This means that the compound is part of a computation job.
-
Sometimes a computation might take a long time (e.g. for compounds with a lot of elements or very high masses). You can cancel running computations by selecting Cancel All in the toolbar.
- Inspect results with the help of the Formulas, Structure and Compound Classes views. Structure and compound class annotations are always based on a selected molecular formula candidate of the compound. Even more details can be found by looking at the Substructure Annotation and Predicted Fingerprint views.
Working with peak list files (not recommended default)
SIRIUS’s “Single mode” corresponds to analyzing a single compound with one or more mass spectra as individual peak list files. This is usually not the recommended format as it misses relevant information that may need to be specified manually.
Example 1: Chelidonine
-
Click the Import Compound Button in the Toolbar to open the importer window.
-
Move each of the three files
demo-data/txt/chelidonine_ms.txt,demo-data/txt/chelidonine_msms1.txtanddemo-data/txt/chelidonine_msms2.txt(one after another) from the demo data via Drag and Drop into the importer window. -
The following dialog offers you to select the columns for mass and intensity values. Just press Ok as the default values are already correct.
-
You see the load dialog with three spectra. The first spectrum is wrongly annotated as MS/MS spectrum but should be an MS1 spectrum instead. Just select MS 1 in the drop down list labeled with ms level.
-
All other options are fine. However, you might want to choose a more memorizable name in the compound name field.
-
Press the OK button. The newly imported compound should now appear in your compound list on the left side.
-
Choose the compound, right-click on it and press Compute.
-
Select SIRIUS. All other options should be fine. Just check that the correct parent mass is chosen. You might want to add Chlorine or Fluorine to the set of considered elements. Furthermore, you can change the instrument type to Orbitrap. Then click Compute.
-
Just look into the candidate list: The first molecular formula has a quite large score. Furthermore, the second molecular formula has a much lower score. This is a good indication that the identification is correct. However, you can take a look at the fragmentation tree: Do the peak annotations look correct? Take a look at the spectrum view: Are all high intensive peaks explained?
-
To write the results into a summary file press the Summaries button. You can find the result list
formula_candidates.tsvat the compound level in the project-space directory.
Example 2: Identifying a CASMI challenge
-
Download the files http://casmi-contest.org/2014/Challenge2014/Challenge1/1_MS.txt and http://casmi-contest.org/2014/Challenge2014/Challenge1/1_MSMS.txt
-
Click the Import Compound Button in the Toolbar to open the importer window.
-
Move these files via Drag and Drop into the importer window (one after another).
-
Change the ms level of the first file into Ms 1
-
Click on OK
-
Click on Compute in the right-click context menu of the imported compound (or double click).
-
Select SIRIUS and choose Q-TOF as instrument and press the OK button
-
C23H46NO7P should be suggested as number one hit in the candidate list
Command Line Interface
The demo-data contains examples for three different data formats readable by SIRIUS.
Example 1: MGF file
The MGF folder contains an example for a MGF file containing a single compound with several MS/MS spectra measured on an Orbitrap instrument. SIRIUS recognizes that these MS/MS spectra belong to the same compound because they have the same parent mass. To analyze this compound, run:
sirius --input demo-data/mgf/laudanosine.mgf --output <outputdir> formula -p orbitrap fingerprint structure compound-classes write-summaries --output <summary-files-dir>
This command runs 4 subtools at once: formula annotation, molecular fingerprint prediction, structure database search and compound class annotation.
The formula_candidates.tsv in <summary-files-dir>/0_laudanosine_FEATURE1 should look like this is:
rank	molecularFormula	adduct	precursorFormula	SiriusScore	TreeScore	IsotopeScore	numExplainedPeaks	explainedIntensity	medianMassErrorFragmentPeaks(ppm)	medianAbsoluteMassErrorFragmentPeaks(ppm)	massErrorPrecursor(ppm)	lipidClass
1	C21H27NO4	[M + H]+	C21H27NO4	24.65417225757305	16.673823307501223	7.98034895007183	10	0.9945969759520045	0.007637492516338191	0.4982304820065859	0.7071154657093854
2	C19H29NO4	[M + Na]+	C19H29NO4	21.14569419257409	15.328042039004671	5.817652153569419	10	0.9945969759520045	0.8982080585874639	1.2778688586195766	7.423133528795216
3	C17H23N7O2	[M + H]+	C17H23N7O2	19.270167038174378	14.209441689860592	5.060725348313786	10	0.9945969759520045	0.8982080585874639	1.2778688586195766	8.203923029468156
4	C15H28N5O3P	[M + H]+	C15H28N5O3P	18.874745611339133	13.87676301554373	4.997982595795404	10	0.9945969759520045	0.8982080585874639	1.2778688586195766	3.5880578691669838
5	C19H25N4O3	[M + H]+	C19H25N4O3	18.047443230086564	10.915836537157713	7.131606692928852	9	0.9900893988366646	-0.01690518911597119	0.6982192702970249	4.455519247668116
6	C17H29N5O	[M + K]+	C17H29N5O	15.00462580213599	14.724156079206512	0.28046972292947725	11	0.9999999999999998	-1.461376225764996	2.4522252659018866	3.2647482579632285
7	C17H30N2O4P	[M + H]+	C17H30N2O4P	14.662475232609417	8.064939679043038	6.597535553566379	9	0.9888793275025645	-0.28967448264108003	0.9201704555380266	-0.1603459126330561
8	C13H33N3O4P2	[M + H]+	C13H33N3O4P2	14.270528279509012	11.207732656567146	3.0627956229418665	10	0.9945969759520047	-0.4982304820065859	1.2778688586195766	-1.0278072909754976
9	C19H31N2O2	[M + K]+	C19H31N2O2	11.942179098282763	10.62247877626541	1.3197003220173515	10	0.9945969759520045	-2.150500852166065	2.150500852166065	-0.48365552383681126
10	C15H34N3O2P	[M + K]+	C15H34N3O2P	11.940863632556848	11.940863632556848	0.0	10	0.9945969759520045	-2.2458900015019885	2.2458900015019885	-1.351116902337944
This is a ranking list of the top molecular formula candidates. The best candidate is C21H27NO4 with an overall score (SiriusScore) of 24.654. This score is the sum of the TreeScore (16.674) and the IsotopeScore (7.980).
The rear columns contain the number of explained peaks in MS/MS spectrum as well as the relative amount of explained intensity. The latter value should usually be over 80 % or even 90 %. If this value is very low you either have strange high intensive noise in your spectrum, or the allowed mass deviation might be too low to explain all the peaks.
The structure_candidates.tsv in <summary-files-dir>/0_laudanosine_FEATURE1 should be similar to this (trunctated version):
rank	formulaRank	ConfidenceScore	CSI:FingerIDScore	molecularFormula	adduct	InChIkey2D	InChI	name	smiles
1	1	0.8708826550014862	-3.262869483152835	C21H27NO4	[M + H]+	KGPAYJZAMGEDIQ	InChI=1S/C21H27NO4/c1-22-9-8-15-12-20(25-4)21(26-5)13-16(15)17(22)10-14-6-7-18(23-2)19(11-14)24-3/h6-7,11-13,17H,8-10H2,1-5H3	Laudanosine	CN1CCC2=CC(=C(C=C2C1CC3=CC(=C(C=C3)OC)OC)OC)OC
2	1	N/A	-86.96508835580653	C21H27NO4	[M + H]+	VDGYRASFPNRLPJ	InChI=1S/C21H27NO4/c1-22(2)9-8-15-12-18(23)20(25-4)13-16(15)17(22)10-14-6-7-19(24-3)21(11-14)26-5/h6-7,11-13,17H,8-10H2,1-5H3/p+1	1-[(3,4-dimethoxyphenyl)methyl]-7-methoxy-2,2-dimethyl-3,4-dihydro-1H-isoquinolin-2-ium-6-ol	C[N+]1(CCC2=CC(=C(C=C2C1CC3=CC(=C(C=C3)OC)OC)OC)O)C
3	1	N/A	-102.18328682988958	C21H27NO4	[M + H]+	VHLMUHYXPXECPC	InChI=1S/C21H27NO4/c1-22(2)9-8-15-12-20(25-4)21(26-5)13-16(15)17(22)10-14-6-7-19(24-3)18(23)11-14/h6-7,11-13,17H,8-10H2,1-5H3/p+1	null	C[N+]1(CCC2=CC(=C(C=C2C1CC3=CC(=C(C=C3)OC)O)OC)OC)C
4	1	N/A	-224.48821737216022	C21H27NO4	[M + H]+	ILJTXKNIYLUOKP	InChI=1S/C21H27NO4/c1-14-18(23-2)7-6-16(21(14)26-5)12-22-9-8-15-10-19(24-3)20(25-4)11-17(15)13-22/h6-7,10-11H,8-9,12-13H2,1-5H3	Oprea1_099380	CC1=C(C=CC(=C1OC)CN2CCC3=CC(=C(C=C3C2)OC)OC)OC
...
This is a ranking of the top structure candidates. The best hit has a confidence score telling you how certain this prediction is correct. Each structure hit also has a formulaRank since a compound may have different molecular formula candidates. The file contains all structure information (InChI, SMILES) and also structure database IDs (not shown here).
The formula_identifications.tsv and compound_identifications.tsv in <summary-files-dir> contain similar information but only for the top hit of each analyzed compound.
The formula_identifications_adduct.tsv and compound_identifications_adduct.tsv contain this information for each possible adduct of each compound.
If you want to look at the fragmentation trees, structures or compound classes visually, you can open the output (<outputdir>)
in the GUI and use the included Tree view tab, Structures tab and
CANOPUS tab .
The output can be imported by dropping the <outputdir> into the SIRIUS GUI application window.
Note that the viewer can also export the tree as vector graphics (svg/pdf).
Example 2: MS files
The demo-data/ms/ directory contains two examples of this format. Each file contains a
single compound measured with an Orbitrap instrument. To analyze this
compound run:
sirius -o <outputdir> -i demo-data/ms/Bicuculline.ms formula -p orbitrap
for formula annotation only or
sirius -o <outputdir> -i demo-data/ms/Bicuculline.ms formula -p orbitrap fingerprint structure compound-classes
to again perform structure database search and compound class annotation.
As the ms file already contains the correct molecular formula, SIRIUS
will directly compute the fragmentation tree without decomposing the
mass (like when specifying exactly one molecular formula via -f option).
If you want to enforce a molecular formula analysis and ranking
(although the correct molecular formula is given within the file) use
the --ignore-formula option to ignore molecular the formula in the file.
The number of formula candidates can be specified via the -c option.
sirius -o <outputdir> -i demo-data/ms/Bicuculline.ms --ignore-formula formula -p orbitrap -c 5
SIRIUS will now ignore the correct molecular formula in the file and output the 5 best candidates.
Example 3: peak lists (txt/csv files)
Note: In general we recommend to use different formats that provide all compound information in one file.
The TXT folder contains simple peaklist files. Such file formats can be easily extracted from Excel spreadsheets. However, they do not contain meta information like the MS level and the parent mass. So you have to specify this information via commandline options:
sirius -1 demo-data/txt/chelidonine_ms.txt -2 demo-data/txt/chelidonine_msms1.txt,demo-data/txt/chelidonine_msms2.txt -z 354.134704589844 -o <outputdir> formula -p orbitrap
The demo data contain a clean MS spectrum (e.g. there is only one
isotope pattern contained in the MS spectrum). In such cases, SIRIUS can
infer the correct parent mass from the MS data (by simply using the
monoisotopic mass of the isotope pattern as parent mass). So you can
omit the -z option in these cases.
Background Service - Generic SIRIUS API
coming soon…